| Using the afsmonitor Program | ||
|---|---|---|
 | Chapter 8. Monitoring and Auditing AFS Performance |  |
| Using the afsmonitor Program | ||
|---|---|---|
| | Chapter 8. Monitoring and Auditing AFS Performance | |
The afsmonitor program enables you to monitor the status and performance of specified File Server and Cache Manager processes by gathering statistical information. Among its other uses, the afsmonitor program can be used to fine-tune Cache Manager configuration and load balance File Servers.
The afsmonitor program enables you to perform the following tasks.
Monitor any number of File Server and Cache Manager processes on any number of machines (in both local and foreign cells) from a single location.
Set threshold values for any monitored statistic. When the value of a statistic exceeds the threshold, the afsmonitor program highlights it to draw your attention. You can set threshold levels that apply to every machine or only some.
Invoke programs or scripts automatically when a statistic exceeds its threshold.
The following software must be accessible to a machine where the afsmonitor program is running:
The AFS xstat libraries, which the afsmonitor program uses to gather data
The curses graphics package, which most UNIX distributions provide as a standard utility
The afsmonitor screens format successfully both on so-called dumb terminals and in windowing systems that emulate terminals. For the output to looks its best, the display environment needs to support reverse video and cursor addressing. Set the TERM environment variable to the correct terminal type, or to a value that has characteristics similar to the actual terminal type. The display window or terminal must be at least 80 columns wide and 12 lines long.
The afsmonitor program must run in the foreground, and in its own separate, dedicated window or terminal. The window or terminal is unavailable for any other activity as long as the afsmonitor program is running. Any number of instances of the afsmonitor program can run on a single machine, as long as each instance runs in its own dedicated window or terminal. Note that it can take up to three minutes to start an additional instance.
No privilege is required to run the afsmonitor program. By convention, it is installed in the /usr/afsws/bin directory, and anyone who can access the directory can monitor File Servers and Cache Managers. The probes through which the afsmonitor program collects statistics do not constitute a significant burden on the File Server or Cache Manager unless hundreds of people are running the program. If you wish to restrict its use, place the binary file in a directory available only to authorized users.
The afsmonitor program displays its data on three screens:
System Overview: This screen appears automatically when the afsmonitor program initializes. It summarizes separately for File Servers and Cache Managers the
number of machines being monitored and how many of them have alerts (statistics that have exceeded
their thresholds). It then lists the hostname and number of alerts for each machine being monitored, indicating if
appropriate that a process failed to respond to the last probe.
File Server: This screen displays File Server statistics for each file server
machine being monitored. It highlights statistics that have exceeded their thresholds, and identifies machines that
failed to respond to the last probe.
Cache Managers: This screen displays Cache Manager statistics for each client
machine being monitored. It highlights statistics that have exceeded their thresholds, and identifies machines that
failed to respond to the last probe.
Fields at the corners of every screen display the following information:
In the top left corner, the program name and version number.
In the top right corner, the screen name, current and total page numbers, and current and total column numbers.
The page number (for example, p. 1 of 3) indicates the index of the current page and
the total number of (vertical) pages over which data is displayed. The column number (for example, c. 1
of 235) indicates the index of the current leftmost column and the total number of columns in which
data appears. (The symbol >>> indicates that there is additional data to the
right; the symbol <<< indicates that there is additional data to the
left.)
In the bottom left corner, a list of the available commands. Enter the first letter in the command name to run
that command. Only the currently possible options appear; for example, if there is only one page of data, the
next and prev commands, which scroll the screen up and
down respectively, do not appear. For descriptions of the commands, see the following section about navigating the
display screens.
In the bottom right corner, the probes field reports how many times the program
has probed File Servers (fs), Cache Managers (cm), or
both. The counts for File Servers and Cache Managers can differ. The freq field reports
how often the program sends probes.
Navigating the afsmonitor Display Screens
As noted, the lower left hand corner of every display screen displays the names of the commands currently available for moving to alternate screens, which can either be a different type or display more statistics or machines of the current type. To execute a command, press the lowercase version of the first letter in its name. Some commands also have an uppercase version that has a somewhat different effect, as indicated in the following list.
cmSwitches to the Cache Managers screen. Available only on the
System Overview and File Servers screens.
fsSwitches to the File Servers screen. Available only on the
System Overview and the Cache Managers
screens.
leftScrolls horizontally to the left, to access the data columns situated to the left of the current set. Available
when the <<< symbol appears at the top left of the screen. Press uppercase
L to scroll horizontally all the way to the left (to display the first set of data
columns).
nextScrolls down vertically to the next page of machine names. Available when there are two or more pages of machines and the final page is not currently displayed. Press uppercase N to scroll to the final page.
oviewSwitches to the System Overview screen. Available only on the
Cache Managers and File Servers screens.
prevScrolls up vertically to the previous page of machine names. Available when there are two or more pages of machines and the first page is not currently displayed. Press uppercase N to scroll to the first page.
rightScrolls horizontally to the right, to access the data columns situated to the right of the current set. This
command is available when the >>> symbol appears at the upper right of the
screen. Press uppercase R to scroll horizontally all the way to the right (to display
the final set of data columns).
The System Overview screen appears automatically as the afsmonitor program initializes. This screen displays the status of as many File Server and Cache
Manager processes as can fit in the current window; scroll down to access additional information.
The information on this screen is split into File Server information on the left and Cache Manager information on the right. The header for each grouping reports two pieces of information:
The number of machines on which the program is monitoring the indicated process
The number of alerts and the number of machines affected by them (an alert means that a statistic has exceeded its threshold or a process failed to respond to the last probe)
A list of the machines being monitored follows. If there are any alerts on a machine, the number of them appears in
square brackets to the left of the hostname. If a process failed to respond to the last probe, the letters
PF (probe failure) appear in square brackets to the left of the hostname.
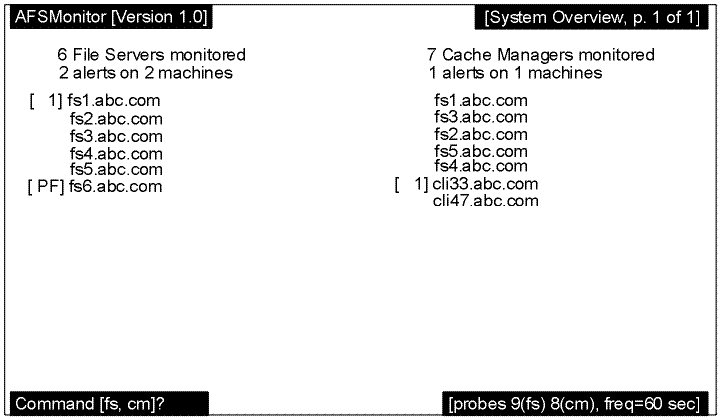
The following graphic is an example System Overview screen. The afsmonitor program is monitoring six File Servers and seven Cache Managers. The File Server process on
host fs1.example.com and the Cache Manager on host cli33.example.com
are each marked [ 1] to indicate that one threshold value is exceeded. The
[PF] marker on host fs6.example.com indicates that its File
Server process did not respond to the last probe.
The File Servers screen displays the values collected at the most recent probe for File
Server statistics.
A summary line at the top of the screen (just below the standard program version and screen title blocks) specifies the number of monitored File Servers, the number of alerts, and the number of machines affected by the alerts.
The first column always displays the hostnames of the machines running the monitored File Servers.
To the right of the hostname column appear as many columns of statistics as can fit within the current width of the
display screen or window; each column requires space for 10 characters. The name of the statistic appears at the top of each
column. If the File Server on a machine did not respond to the most recent probe, a pair of dashes
(--) appears in each column. If a value exceeds its configured threshold, it is highlighted
in reverse video. If a value is too large to fit into the allotted column width, it overflows into the next row in the same
column.
For a list of the available File Server statistics, see Appendix C, The afsmonitor Program Statistics.
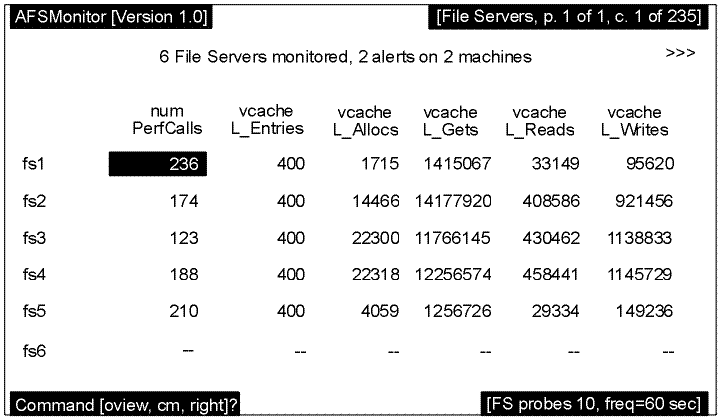
The following graphic depicts the File Servers screen that follows the System Overview
Screen example previously discussed; however, one additional server probe has been completed. In this example, the File Server
process on fs1 has exceeded the configured threshold for the number of performance calls
received (the numPerfCalls statistic), and that field appears in reverse video. Host
fs6 did not respond to Probe 10, so dashes appear in all fields.
Both the File Servers and Cache Managers screen (discussed in the following section) can display hundreds of columns of
data and are therefore designed to scroll left and right. In the preceding graphic, the screen displays the leftmost screen
and the screen title block shows that column 1 of 235 is displayed. The appearance of the
>>> symbol in the upper right hand corner of the screen and the right command in the command block indicate that additional data is available by scrolling right. (For
information on the available statistics, see Appendix C, The afsmonitor Program
Statistics.)
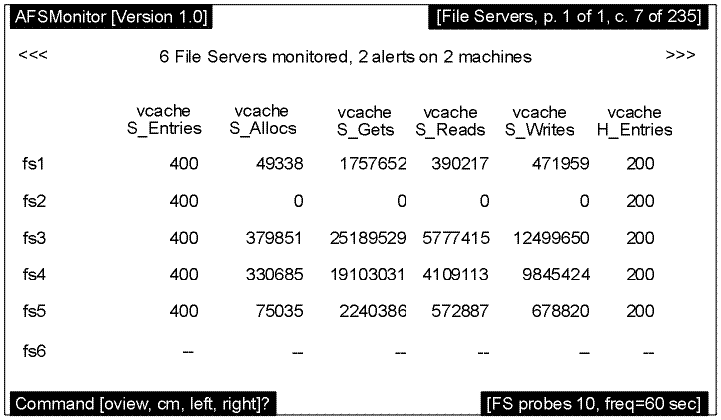
If the right command is executed, the screen looks something like the following
example. Note that the horizontal scroll symbols now point both to the left (<<<)
and to the right (>>>) and both the left and
right commands appear, indicating that additional data is available by scrolling both left
and right.
The Cache Managers screen displays the values collected at the most recent probe for
Cache Manager statistics.
A summary line at the top of the screen (just below the standard program version and screen title blocks) specifies the number of monitored Cache Managers, the number of alerts, and the number of machines affected by the alerts.
The first column always displays the hostnames of the machines running the monitored Cache Managers.
To the right of the hostname column appear as many columns of statistics as can fit within the current width of the
display screen or window; each column requires space for 10 characters. The name of the statistic appears at the top of each
column. If the Cache Manager on a machine did not respond to the most recent probe, a pair of dashes
(--) appears in each column. If a value exceeds its configured threshold, it is highlighted
in reverse video. If a value is too large to fit into the allotted column width, it overflows into the next row in the same
column.
For a list of the available Cache Manager statistics, see Appendix C, The afsmonitor Program Statistics.
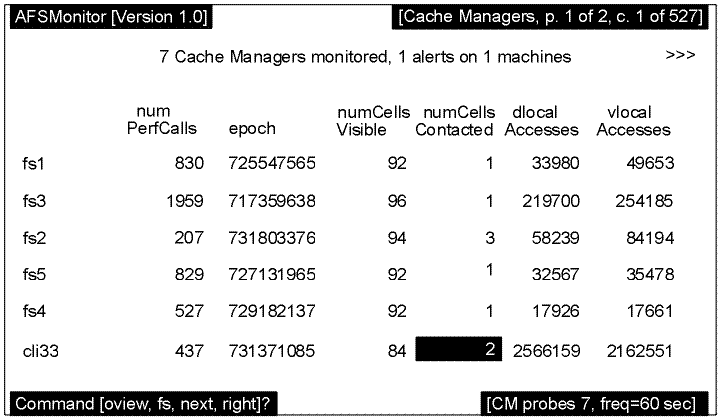
The following graphic depicts a Cache Managers screen that follows the System Overview Screen previously discussed. In the example, the Cache Manager process on host cli33 has exceeded the configured threshold for the number of cells it can contact (the numCellsContacted statistic), so that field appears in reverse video.
| |  | |
| Using the fstrace Command Suite |  | Configuring the afsmonitor Program |