| Using the scout Program | ||
|---|---|---|
 | Chapter 8. Monitoring and Auditing AFS Performance |  |
| Using the scout Program | ||
|---|---|---|
| | Chapter 8. Monitoring and Auditing AFS Performance | |
The scout program monitors the status of the File Server process running on file server machines. It periodically collects statistics from a specified set of File Server processes, displays them in a graphical format, and alerts you if any of the statistics exceed a configurable threshold.
More specifically, the scout program includes the following features.
You can monitor, from a single location, the File Server process on any number of server machines from the local and foreign cells. The number is limited only by the size of the display window, which must be large enough to display the statistics.
You can set a threshold for many of the statistics. When the value of a statistic exceeds the threshold, the scout program highlights it (displays it in reverse video) to draw your attention to it. If the value goes back under the threshold, the highlighting is deactivated. You control the thresholds, so highlighting reflects what you consider to be a noteworthy situation. See Highlighting Significant Statistics.
The scout program alerts you to File Server process, machine, and network outages by highlighting the name of each machine that does not respond to its probe, enabling you to respond more quickly.
You can set how often the scout program collects statistics from the File Server processes.
The scout program runs on any AFS client machine that has access to the curses graphics package, which most UNIX distributions include as a standard utility. It can run on both dumb terminals and under windowing systems that emulate terminals, but the output looks best on machines that support reverse video and cursor addressing. For best results, set the TERM environment variable to the correct terminal type, or one with characteristics similar to the actual ones. For machines running AIX, the recommended TERM setting is vt100, assuming the terminal is similar to that. For other operating systems, the wider range of acceptable values includes xterm, xterms, vt100, vt200, and wyse85.
No privilege is required to run the scout program, so any user who can access the directory where its binary resides (the /usr/afsws/bin directory in the conventional configuration) can use it. The program's probes for collecting statistics do not impose a significant burden on the File Server process, but you can restrict its use by placing the binary file in a directory with a more restrictive access control list (ACL).
Multiple instances of the scout program can run on a single client machine, each over its own dedicated connection (in its own window). It must run in the foreground, so the window in which it runs does not accept further input except for an interrupt signal.
You can also run the scout program on several machines and view its output on a single machine, by opening telnet connections to the other machines from the central one and initializing the program in each remote window. In this case, you can include the -host flag to the scout command to make the name of each remote machine appear in the banner line at the top of the window displaying its output. See The Banner Line.
As previously mentioned, the scout program can monitor the File Server process on any number of file server machines. If all of the machines belong to the same cell, then their hostnames probably all have the same domain name suffix, such as example.com in the Example Corporation cell. In this case, you can use the -basename argument to the scout command, which has several advantages:
You can omit the domain name suffix as you enter each file server machine's name on the command line. The scout program automatically appends the domain name to each machine's name, resulting in a fully-qualified hostname. You can omit the domain name suffix even when you don't include the -basename argument, but in that case correct resolution of the name depends on the state of your cell's naming service at the time of connection.
The machine names are more likely to fit in the appropriate column of the display without having to be truncated (for more on truncating names in the display column, see The Statistics Display Region).
The domain name appears in the banner line at the top of the display window to indicate the name of the cell you are monitoring.
The scout program can display statistics either in a dedicated window or on a plain screen if a windowing environment is not available. For best results, use a window or screen that can print in reverse video and do cursor addressing.
The scout program screen has three main regions: the banner line, the statistics display region and the probe/message line. This section describes their contents, and graphic examples appear in Example Commands and Displays.
By default, the string scout appears in the banner line at the top of the window or
screen, to indicate that the scout program is running. You can display two additional types
of information by include the appropriate option on the command line:
Include the -host flag to display the local machine's name in the banner line. This is particularly useful when you are running the scout program on several machines but displaying the results on a single machine.
For example, the following banner line appears when you run the scout program on the machine client1.example.com and use the-host flag:
[client1.example.com] scout
Include the -basename argument to display the specified cell domain name in the banner line. For further discussion, see Using the -basename argument to Specify a Domain Name.
For example, if you specify a value of example.com for the -basename argument, the banner line reads:
scout for example.com
The statistics display region occupies most of the window and is divided into six columns. The following list describes them as they appear from left to right in the window.
ConnDisplays the number of RPC connections open between the File Server process and client machines. This number
normally equals or exceeds the number in the fourth Ws column. It can exceed the
number in that column because each user on the machine can have more than one connection open at once, and one
client machine can handle several users.
FetchDisplays the number of fetch-type RPCs (fetch data, fetch access list, and fetch status) that the File Server process has received from client machines since it started. It resets to zero when the File Server process restarts.
StoreDisplays the number of store-type RPCs (store data, store access list, and store status) that the File Server process has received from client machines since it started. It resets to zero when the File Server process restarts.
WsDisplays the number of client machines (workstations) that have communicated with the File Server process
within the last 15 minutes (such machines are termed active). This number is likely to be
smaller than the number in the Conn) column because a single client machine can
have several connections open to one File Server process.
Displays the name of the file server machine on which the File Server process is running. It is 12 characters
wide. Longer names are truncated and an asterisk (*) appears as the last character
in the name. If all machines have the same domain name suffix, you can use the -basename argument to decrease the need for truncation; see Using
the -basename argument to Specify a Domain Name.
Disk attnDisplays the number of kilobyte blocks available on up to 26 of the file server machine's AFS server (/vicep) partitions. The display for each partition has the following format:
partition_letter:free_blocks
For example, a:8949 indicates that partition /vicepa has 8,949 KB free. If the window is not wide enough for all partition entries to
appear on a single line, the scout program automatically stacks the partition
entries into subcolumns within the sixth column.
The label on the Disk attn column indicates the threshold value at which
entries in the column become highlighted. By default, the scout program highlights
a partition that is over 95% full, in which case the label is as follows:
Disk attn: > 95% used
For more on this threshold and its effect on highlighting, see Highlighting Significant Statistics.
For all columns except the fifth (file server machine name), you can use the -attention argument to set a threshold value above which the scout program highlights the statistic. By default, only values in the fifth and sixth columns ever become highlighted. For instructions on using the -attention argument, see Highlighting Significant Statistics.
The bottom line of the display indicates how many times the scout program has probed the File Server processes for statistics. The statistics gathered in the latest probe appear in the statistics display region. By default, the scout program probes the File Servers every 60 seconds, but you can use the -frequency argument to specify a different probe frequency.
To draw your attention to a statistic that currently exceed a threshold value, the scout program displays it in reverse video (highlights it). You can set the threshold value for most statistics, and so determine which values are worthy of special attention and which are normal.
The only column in which you cannot control highlighting is the fifth, which identifies the file server machine for which statistics are displayed in the other columns. The scout program uses highlighting in this column to indicate that the File Server process on a machine fails to respond to its probe, and automatically blanks out the other columns. Failure to respond to the probe can indicate a File Server process, file server machine, or network outage, so the highlighting draws your attention to a situation that is probably interrupting service to users.
When the File Server process once again responds to the probes, its name appears normally and statistics reappear in the other columns. If all machine names become highlighted at once, a possible network outage has disrupted the connection between the file server machines and the client machine running the scout program.
To set the threshold value for one or more of the five statistics-displaying columns, use the -attention argument. The threshold value applies to all File Server processes you are monitoring (you cannot set different thresholds for different machines). For details, see the syntax description in To start the scout program.
It is not possible to change the threshold values for a running scout program. Stop the current program and start a new one. Also, the scout program does not retain threshold values across restarts, so you must specify all thresholds every time you start the program.
Do not resize the display window while the scout program is running. Increasing the size does no harm, but the scout program does not necessarily adjust to the new dimensions. Decreasing the display's width can disturb column alignment, making the display harder to read. With any type of resizing, the scout program does not adjust the display in any way until it displays the results of the next probe.
To resize the display effectively, stop the scout program, resize the window and then restart the program. Even in this case, the scout program's response depends on the accuracy of the information it receives from the display environment. Testing during development has shown that the display environment does not reliably provide information about window resizing. If you use the X windowing system, issuing the following sequence of commands before starting the scout program (or placing them in the shell initialization file) sometimes makes it adjust properly to resizing.
   % set noglob
   % eval '/usr/bin/X11/resize'
   % unset noglob
Open a dedicated command shell. If necessary, adjust it to the appropriate size.
Issue the scout command to start the program.
   % scout  [initcmd]  -server <FileServer name(s) to monitor>+  \
            [-basename <base server name>]  \
            [-frequency <poll frequency, in seconds>] [-host]  \
            [-attention <specify attention (highlighting) level>+]  \
            [-debug <turn debugging output on to the named file>]
where
Is an optional string that accommodates the command's use of the AFS command parser. It can be omitted and ignored.
Identifies each File Server process to monitor, by naming the file server machine it is running on. Provide fully-qualified hostnames unless the -basename argument is used. In that case, specify only the initial part of each machine name, omitting the domain name suffix common to all the machine names.
Specifies the domain name suffix common to all of the file server machines named by the -server argument. For discussion of this argument's effects, see Using the -basename argument to Specify a Domain Name.
Do not include the period that separates the domain suffix from the initial part of the machine name, but do include any periods that occur within the suffix itself. (For example, in the Example Corporation cell, the proper value is example.com, not .example.com.)
Sets the frequency, in seconds, of the scout program's probes to File Server processes. Specify an integer greater than 0 (zero). The default is 60 seconds.
Displays the name of the machine that is running the scout program in the display window's banner line. By default, no machine name is displayed.
Defines the threshold value at which to highlight one or more statistics. You can provide the pairs of statistic and threshold in any order, separating each pair and the parts of each pair with one or more spaces. The following list defines the syntax for each statistic.
Highlights the value in the Conn (first) column when the number of
connections that the File Server has open to client machines exceeds the connections value. The
highlighting deactivates when the value goes back below the threshold. There is no default
threshold.
Highlights the value in the Fetch (second) column when the number
of fetch RPCs that clients have made to the File Server process exceeds the fetch_RPCs value. The
highlighting deactivates only when the File Server process restarts, at which time the value returns to
zero. There is no default threshold.
Highlights the value in the Store (third) column when the number of
store RPCs that clients have made to the File Server process exceeds the store_RPCs value. The
highlighting deactivates only when the File Server process restarts, at which time the value returns to
zero. There is no default threshold.
Highlights the value in the Ws (fourth) column when the number of
active client machines (those that have contacted the File Server in the last 15 minutes) exceeds the
active_clients value. The highlighting deactivates when the value goes back below the threshold. There is
no default threshold.
Highlights the value for a partition in the Disk attn (sixth)
column when either the amount of disk space used exceeds the percentage indicated by thepercent_full
value, or the number of free KB blocks is less than the min_blocks value. The highlighting deactivates
when the value goes back below the percent_full threshold or above the min_blocks threshold.
The value you specify appears in the header of the sixth column following the string
Disk attn. The default threshold is 95% full.
Acceptable values for percent_full are the integers from the range 0 (zero) to 99, and you must include the percent sign to distinguish this statistic from a min_blocks value..
The following example sets the threshold for the Conn column to 100, for
the Ws column to 50, and for the Disk attn
column to 75%. There is no threshold for the Fetch and
Store columns.
-attention conn 100 ws 50 disk 75%
The following example has the same affect as the previous one except that it sets the threshold for the Disk attn column to 5000 free KB blocks:
-attention disk 5000 ws 50 conn 100
Enables debugging output and directs it into the specified file. Partial pathnames are interpreted relative to the current working directory. By default, no debugging output is produced.
Enter Ctrl-c in the display window. This is the proper interrupt signal even if the general interrupt signal in your environment is different.
This section presents examples of the scout program, combining different arguments and illustrating the screen displays that result.
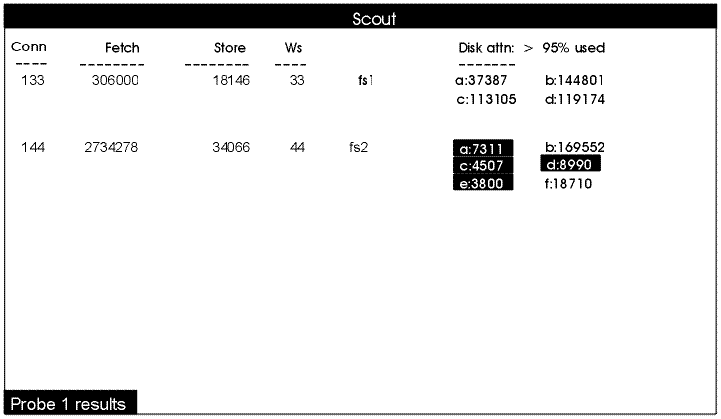
In the first example, an administrator in the Example Corporation issues the scout command without providing any optional arguments or flags. She includes the -server argument because she is providing multiple machine names. She chooses to specify on the initial part of each machine's name even though she has not used the -basename argument, relying on the cell's name service to obtain the fully-qualified name that the scout program requires for establishing a connection.
% scout -server fs1 fs2
Figure 2 depicts the resulting display. Notice first that the machine names in the fifth
(unlabeled) column appear in the format the administrator used on the command line. Now consider the second line in the
display region, where the machine name fs2 appears in the fifth column. The
Conn and Ws columns together show that machine fs2 has 144 RPC connections open to 44 client machines, demonstrating that multiple connections per
client machine are possible. The Fetch column shows that client machines have made 2,734,278
fetch RPCs to machine fs2 since the File Server process last started and the
Store column shows that they have made 34,066 store RPCs.
Six partition entries appear in the Disk attn column, marked
a through f (for /vicepa
through /vicepf). They appear on three lines in two subcolumns because of the width of the
window; if the window is wider, there are more subcolumns. Four of the partition entries (a,
c, d, and e) appear in
reverse video to indicate that they are more than 95% full (the threshold value that appears in the Disk
attn header).
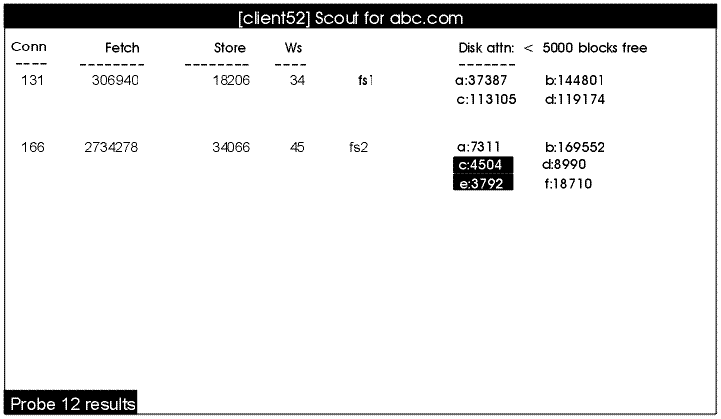
In the second example, the administrator uses more of the scout program's optional arguments.
She provides the machine names in the same form as in Example 1, but this time she also uses the -basename argument to specify their domain name suffix, example.com. This implies that the scout program does not need the name service to expand the names to fully-qualified hostnames, but the name service still converts the hostnames to IP addresses.
She uses the -host flag to display in the banner line the name of the client machine where the scout program is running.
She uses the -frequency argument to changes the probing frequency from its default of once per minute to once every five seconds.
She uses the -attention argument to changes the highlighting threshold for partitions to a 5000 KB minimum rather than the default of 95% full.
% scout -server fs1 fs2 -basename example.com -host -frequency 5 -attention disk 5000
The use of optional arguments results in several differences between Figure 3 and Figure 2. First, because the -host flag is included, the banner
line displays the name of the machine running the scout process as
[client52] along with the basename example.com specified with
the -basename argument.
Another difference is that two rather than four of machine fs2's partitions appear in
reverse video, even though their values are almost the same as in Figure 2. This is because
the administrator changed the highlight threshold to a 5000 block minimum, as also reflected in the Disk
attn column's header. And while machine fs2's partitions /vicepa and /vicepd are still 95% full, they have more than 5000 free
blocks left; partitions /vicepc and /vicepe are highlighted
because they have fewer than 5000 blocks free.
Note also the result of changing the probe frequency, reflected in the probe reporting line at the bottom left corner of the display. Both this example and the previous one represent a time lapse of one minute after the administrator issues the scout command. In this example, however, the scout program has probed the File Server processes 12 times as opposed to once
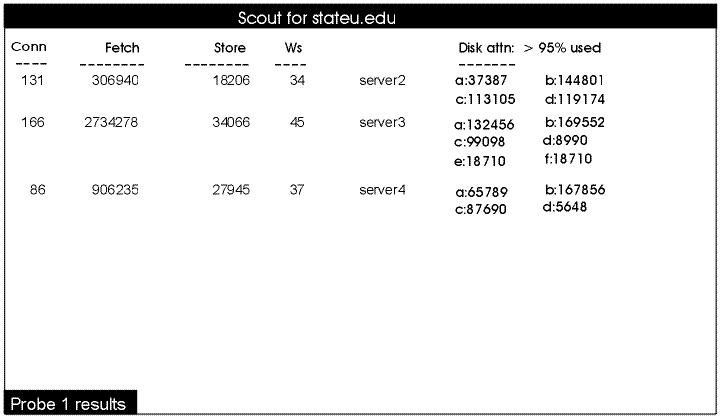
In Figure 4, an administrator in the State University cell monitors three of that cell's file server machines. He uses the -basename argument to specify the stateu.edu domain name.
% scout -server server2 server3 server4 -basename stateu.edu
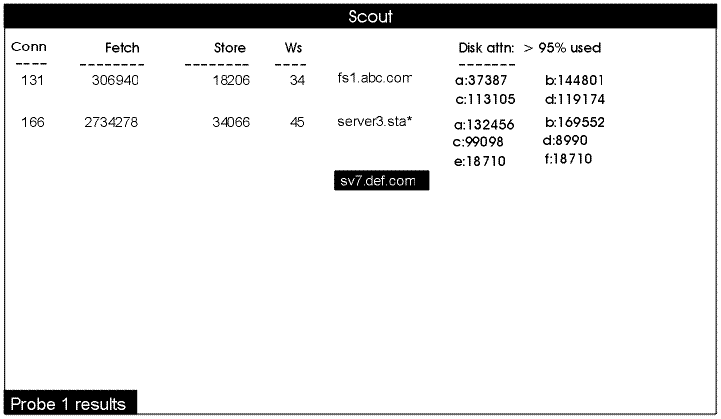
Figure 5 illustrates three of the scout program's features. First, you can monitor file server machines from different cells in a single display: fs1.abc.com, server3.stateu.edu, and sv7.def.com. Because the machines belong to different cells, it is not possible to provide the -basename argument.
Second, it illustrates how the display must truncate machine names that do not fit in the fifth column, using an asterisk at the end of the name to show that it is shortened.
Third, it illustrates what happens when the scout process cannot reach a File Server process, in this case the one on the machine sv7.def.com: it highlights the machine name and blanks out the values in the other columns.
| |  | |
| Chapter 8. Monitoring and Auditing AFS Performance |  | Using the fstrace Command Suite |